Tim Morgans Seeds Falsified? Peak Oil Falsified.
The Peak Oil theory refuses to die, it is contradicted by the evidence.
Based on the provided content, I'll summarize the key arguments challenging the EROI (Energy Return on Investment) decline narrative:
Empirical Evidence vs. Theoretical Claims:
The Brandt paper (2015) shows an average EROI of 33:1 (33 barrels out for 1 barrel invested) [1]
This contrasts with Tim Morgan's SEEDS model claiming EROI has declined to 9:1, which is challenged as lacking empirical support [2]
The empirical data from giant fields like Ghawar shows EROI between 35-40:1, significantly higher than claimed declining rates [3]
Technological Improvements:
Modern deep water rigs show competitive EROI rates (e.g., Girasol in Angola, Hibernian in Canada) [4]
Adelman's research shows that technological advances have consistently improved recovery rates and efficiency [5]
The Kern River field case study demonstrated how technology improved recovery from 54 million to 970 million barrels between 1942-1986 [6]
Price Control vs. Scarcity:
Blair and Adelman's work shows oil prices are more influenced by cartel behavior than actual scarcity [7]
The Texas Railroad Commission's historical role in price support demonstrates institutional price control [8]
Bichler and Nitzan's research indicates oil pricing reflects differential profits rather than actual resource scarcity [9]
Petrodollar Connection:
The pegging of oil to the dollar created artificial price support mechanisms [10]
Saudi Arabia's role as swing producer was more about currency management than resource scarcity [11]
The "plateau oil" concept relates more to monetary policy than actual resource limitations [12]
Key Counter-Evidence to Peak Oil:
U.S. production reached 9.24 million barrels per day in recent years, highest since 1972 [13]
Domestic crude reserves increased to 33.4 billion barrels, highest since 1976 [14]
Natural gas reserves rose from 1.3 trillion to 2.3 trillion cubic feet between 2000-2013 [15]
The analysis suggests that EROI decline narratives may be oversimplified and that hydrocarbon abundance, combined with monetary and political factors, plays a more significant role in energy economics than pure resource depletion theories suggest.
https://www.goodreads.com/author/quotes/907695.Ludvig_Holberg?page=2
Monicas Epistle to Holberg
In the world of plays and literary criticism,
Logical rules may not always guarantee the name of a play.
In the realm of religious practice and love thy neighbor,
Words are spoken, but actions speak louder.
Useful books are those that stir commerce and trade,
Not just vain learning that the common people evade.
When it comes to faith and belief,
Question everything and seek relief.
In the company of men, wine and tobacco may flow,
But in women's rooms, tea, coffee, and conversation bestow.
Morality and virtue, not just for show,
But a guiding light for all to know.
From different tastes to differing opinions,
Tolerance and understanding can bridge divisions.
In the pursuit of truth and reason,
Let sense prevail in every season.
Learning from peasants and their practicality,
A wisdom that transcends mere formality.
Drunkenness replaced by tea and coffee's grace,
A societal shift to a more sober embrace.
In the realm of science, divine or worldly,
Let not blind subscription rule unfairly.
For once disrepute takes its hold,
Strange fictions can be easily sold.
In the end, let reason guide our way,
And let wisdom be our constant stay.
Cooperation,GameTheory,12Log2-8, Axelrod,Nowack & Goodwill Hunting
I wrote this note to a friend in October 2016.
Why we need to put the question-mark back
In opening this post today, I constructed the draft in Libre Office Writer under the title ‘2024/25turningpoint?’
All of which brings me to the recent post by prolific substacker Dr John Day on the very same subject – “are we at a turning point in the alignment of political Parties in the US?” The reason Dr John’s blog is always worth a visit is because he is possibly the most voracious reader on the planet, and is excellent in his discernment of the shit v sugar thing. He is also to be admired and respected because his licence to practice medicine was revoked by the Fauci gargoyles at the outset of the Covid19 scam: thus he is a bloke who has been unjustly deprived of income, his sole crime having been to refuse to administer Pfizer’s mRNA “vaccine” – a killer drug now at last so branded as I recorded on December 11th last:
‘…you can go here to the official US medical output source and read this clearly stated debunking of the “no connection” falsehood:
‘The temporal relationship, internal and external consistency seen among cases in this review with known COVID-19 vaccine-induced myocarditis, its pathobiological mechanisms, and related excess death, complemented with autopsy confirmation, independent adjudication, and application of the Bradford Hill criteria to the overall epidemiology of vaccine myocarditis, suggests that there isa high likelihood of a causal link between COVID-19 vaccines and death from myocarditis’.
In his most recent post, John Day points us at an Albrt’s Blog post entitled ‘Twirling Towards Freedom?’
I had never heard of Albrt’s Blog until yesterday, but Doctor John never misses a trick. The post is a stunning analysis of whether the forthcoming Trump/Vance administration will produce real change in the American elite – a genuine realignment in US politics – or simply more of the same. Albrt sums up his essay as follows:
‘The first assumption this post makes is that a long-term realignment is in play. The second assumption is that the realignment has not yet been fully accomplished. The third assumption is that it should be possible for a non-expert (like me) to look at how the Trump-Vance administration implements its policies and tell whether they are serious about delivering concrete material benefits for working class citizens in order to consolidate the realignment.’
This is the Thing with Dr John Day: while the rest of us sleep, he highlights stuff of high quality and helps guide the Open Mind. This isn’t about agreeing with even half of Albrt’s hypothesis, it’s about informing the debate with which I commenced this morning, viz – will the Trump inauguration represent a turning point in the search for honesty, or will it simply comply with the status quo? [Yet another question mark, he quipped]. As I have stated on many occasions, this is not about partisan support, but rather Holding All Power to Account. I wrote last November 11th:
‘In terms of control of Congress and a whopping Electoral College majority, on November 5th 2024 American registered voters effectively gave Donald Trump a blank cheque. Now he and his team must use it, but not abuse it’
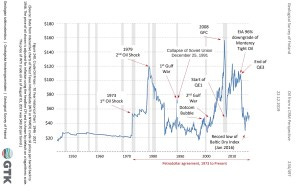
Oil Man Art Berman, This Is How Oil Ends (Our current oil production plateau won't likely persist past 2030, if that) The era of cheap oil ended two decades ago, when the average price jumped from $35 in the 1990s to over $90 since 2000.
The peak oil movement understood that part but missed how long debt could delay the inevitable decline in oil use. It’s still uncertain whether this will play out as peak oil, peak plateau, or peak demand. One thing, however, is certain: the future that peak oil warned about 20 years ago is here. And no matter how it unfolds, economic growth is heading for a serious reckoning.
It looked like the world might be running out of affordable oil during the first 15 years of this century. Prices hit $190 per barrel in 2008, adjusted for today’s dollars, and averaged nearly $150 from 2011 to late 2014 (Figure 1). Then the shale plays came online, and to many, peak oil seemed like a false alarm. https://www.artberman.com/blog/this-is-how-oil-ends/ Gail Tverberg point out that we may be in post-peak-affordable-uranium, too, as we have been using up decades of highly-enriched nuclear-warhead uranium in our reactors for 20 years. Nuclear electricity generation has hidden problems; don’t expect advanced modular units to solve them. What I see is that the relatively “flat” overall nuclear electricity production has been accomplished, to a significant extent, by the “Advanced Economies, ex US” dropping back in their use of nuclear electricity at close to the same time the “Later Entrants” have rapidly been increasing their use of nuclear electricity. The Later Entrants can make goods for sale in international markets much more cheaply than the Advanced Economies, ex US through their efficient use of cheap energy (often from coal) and their lower wages. This more efficient approach gives the Later Entrants an “edge” in buying the uranium that is available. I expect to see more of this pattern of squeezing out in the future. In fact, new and recently re-opened nuclear plants will need to compete existing nuclear generation units for available uranium.
Given the way squeezing out takes place, very few people will realize that there is a problem with uranium fuel. It will just be that leaders of some parts of the world, as well as some parts of the US, will start emphasizing stories about how dangerous nuclear energy is. Instead of nuclear, they will emphasize electricity generation from wind and solar and allow these approaches to “go first” when they are available. The result will be wholesale electricity prices that will be far too low for nuclear power plants, much of the time. It will be these low wholesale electricity prices that push nuclear power out.
Thus, unless there truly are breakthroughs in recycling spent fuels, or in uranium mining, electricity generation using nuclear energy may gradually slip away from many parts of the world currently using it. https://ourfiniteworld.com/2024/11/11/nuclear-electricity-generation-has-hidden-problems-dont-expect-advanced-modular-units-to-solve-them/Russia imposes 'temporary' ban on enriched uranium exports to US https://en.topwar.ru/253818-rossija-vvela-vremennyj-zapret-na-jeksport-obogaschennogo-urana-v-soedinennye-shtaty.html
The analysis indicates that claims of inevitably declining EROI may be oversimplified and not supported by empirical evidence. The actual data suggests technological improvements and efficiency gains have maintained or improved energy returns in many cases.
https://www.eia.gov/finance/performanceprofiles/oil_gas.php
Finding and lifting costs both declined.
Average worldwide finding costs for the FRS companies decreased to $18.31 per barrel of oil equivalent (boe) of reserves added in the 2007-2009 period compared with the 2006-2008 period, a decline of $5.79 per boe from 2008. Finding costs declined in all FRS regions except the Former Soviet Union, Africa, and the Middle East. The U.S. Offshore, which had the highest finding costs among the FRS regions in 2006-2008, had the largest fall in 2007-2009. Europe's costs also fell substantially in 2007-2009. Europe had the highest finding costs among the foreign regions in 2006-2008. Canada displayed a large decline in part likely because of the inclusion of oil sands in 2009.
Reversing an almost decade-long trend, worldwide total lifting costs for the FRS companies fell $2.66 per boe, to $10.04 per boe, in 2009. Total lifting costs also fell in each of the FRS regions except Canada, where they rose $2.49, probably reflecting the inclusion of oil sands in 2009. Production taxes were the major contributor to the decline in total lifting costs. Worldwide they declined $2.30 per boe in 2009, which is 86 percent of the decline in total lifting costs. Production taxes typically rise and fall with changes in the prices of oil and natural gas, both of which fell in 2009. Direct lifting costs fell 14 percent in the United States but increased in every foreign region. Finding and lifting costs combined fell more than $5 per boe in the 2007-2009 period to $29.31 per boe.
Limits on OPEC Output Increase Global Oil Production Costs
12/27/2017
Summary of working paper 23801
Featured in print Digest
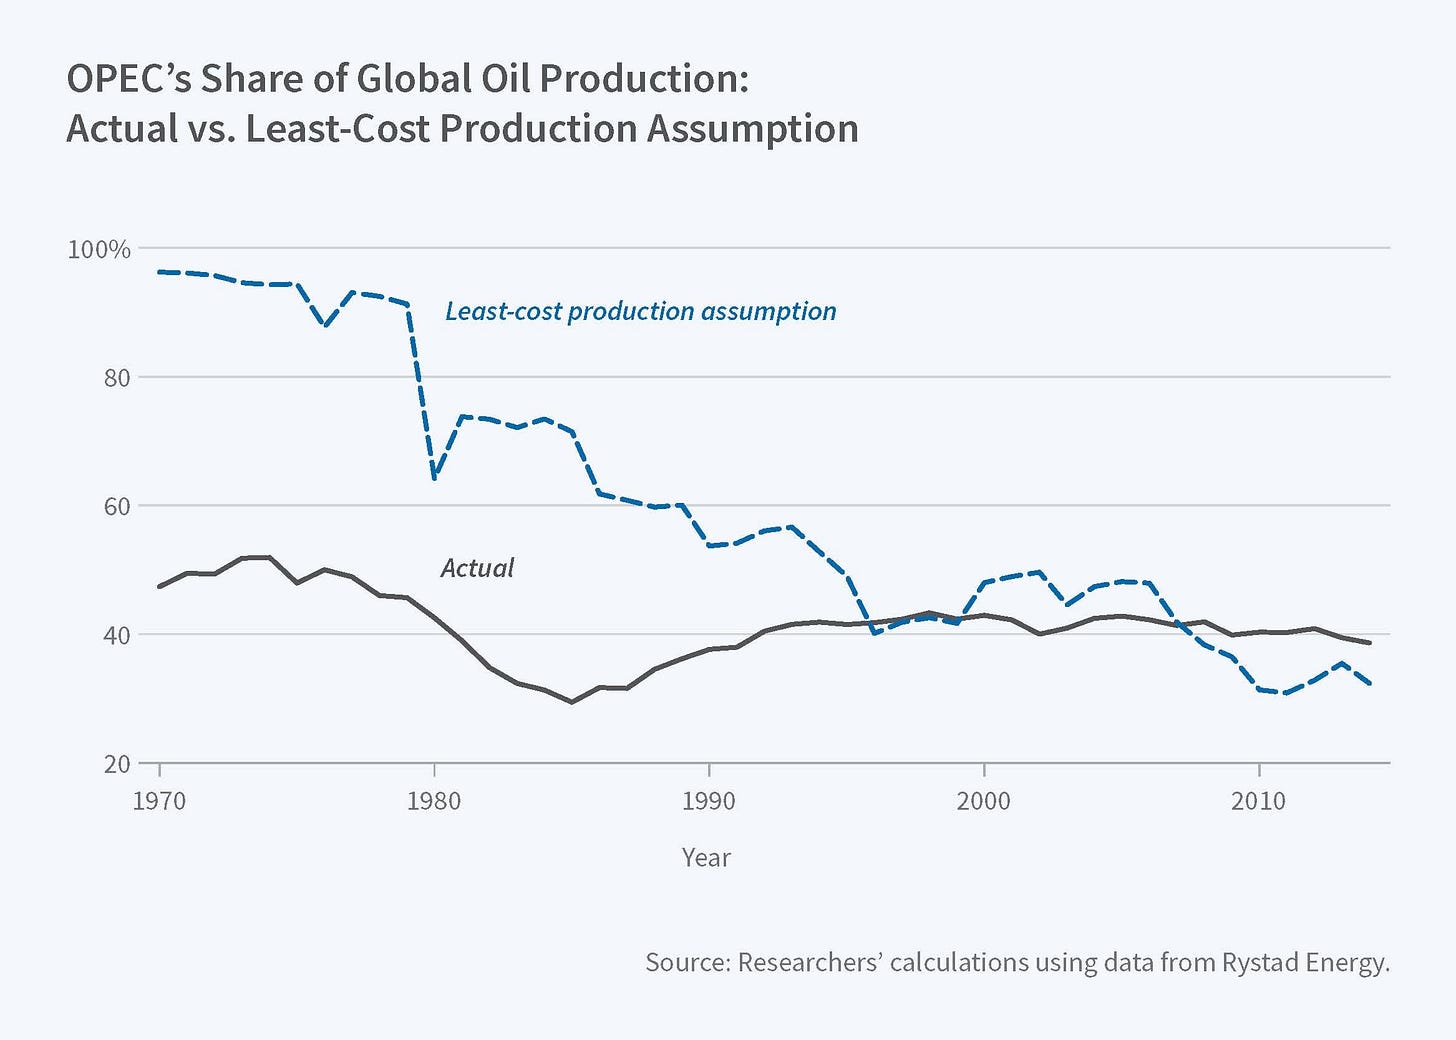
Because the lowest-cost oil producers are OPEC members, unrestrained production by cartel members would substantially reduce Russian and American shares of the world market.
Every microeconomics textbook explains that a business with market power can increase its profit by restricting output. In some cases, such quantity restrictions can lead to production being shifted to other firms. If those firms are relatively high-cost producers, this misallocation of production benefits the firm with market power, but means that society must spend more than it otherwise would to produce a given output.
In Market Power, Production (Mis)-Allocation, and OPEC (NBER Working Paper No. 23801), John Asker, Allan Collard-Wexler, and Jan De Loecker estimate that OPEC's exercise of market power to hold down output of petroleum shifted substantial amounts of oil production from low-cost fields to higher-cost ones, imposing extra oil production costs of $163 billion (in 2014 USD) on the global economy from 1970 through 2014.
The researchers use data from Rystad Energy to estimate the costs of production misallocation. These data include estimates of oil production and costs for 13,248 oil fields that were active at some point during the period 1970-2014.
Oil production costs vary by geologic formation. In 2014, these costs ranged from an average of $7 a barrel for the Ghawar field in Saudi Arabia, to $21 a barrel in the offshore Norwegian fields, to $51 a barrel in the Bakken shale in the United States.
OPEC members generally face much lower costs of production than other producers. In Saudi Arabia and Kuwait, production costs per barrel rarely exceeded $10 per barrel throughout the study period, and median costs were $5.40 a barrel. At the 95th percentile, the production cost was about $10 per barrel. By contrast, among producers outside the OPEC cartel, median costs were closer to $9.70 a barrel, with the 95th percentile at $28.20 per barrel. Thus, if OPEC withholds production, say by limiting output from its most expensive fields, this will induce production to expand in the more expensive fields in the rest of the world, resulting in misallocated production. If OPEC withholds production from its cheaper fields, such as those in Saudi Arabia, then the resulting cost increase is even higher.
The U.S. oil industry has been shaped, in large part, by the substitution of production away from cheap OPEC reserves toward the rest of the world. In 2005, shale accounted for just 24 million of the 2480 million barrels of oil produced in the U.S., or less than 1 percent. In 2014, 2039 million of the 4173 million barrels of oil produced — nearly half — were from shale. This expansion in higher-cost shale oil production was the primary driver behind an increase in the average cost per barrel of U.S. oil from $7.30 in 2002 to $20 in 2014. The researchers' analysis shows that this expansion in shale oil production would not have occurred if OPEC members had not restricted supply.
To estimate the effect of OPEC's market power, the researchers compare the cost of actual production each year with the cost of producing the same amount of oil using the lowest-cost fields, as would occur in a competitive market. They show that if production were allocated across countries to minimize production costs, then in 2014 the market share of the lower-production-cost Gulf countries would have increased from 25.8 to 74.4 percent. The Saudi Arabian share would increase to 28.1 percent and the Kuwaiti share to 12.5 percent, as opposed to current output shares of 13.3 and 3.0 percent. Production by non-OPEC, higher-cost producers would have fallen, with the U.S. share of the market falling from 13.2 to 1.3 percent and Russia falling from 14.4 to 4.7 percent.
https://reports.shell.com/investors-handbook/2019/upstream/conventional-oil-gas.html
In Market Power, Production (Mis)-Allocation, and OPEC (NBER Working Paper No. 23801), John Asker, Allan Collard-Wexler, and Jan De Loecker estimate that OPEC's exercise of market power to hold down output of petroleum shifted substantial amounts of oil production from low-cost fields to higher-cost ones, imposing extra oil production costs of $163 billion (in 2014 USD) on the global economy from 1970 through 2014.
The researchers use data from Rystad Energy to estimate the costs of production misallocation. These data include estimates of oil production and costs for 13,248 oil fields that were active at some point during the period 1970-2014.
Oil production costs vary by geologic formation. In 2014, these costs ranged from an average of $7 a barrel for the Ghawar field in Saudi Arabia, to $21 a barrel in the offshore Norwegian fields, to $51 a barrel in the Bakken shale in the United States.
OPEC members generally face much lower costs of production than other producers. In Saudi Arabia and Kuwait, production costs per barrel rarely exceeded $10 per barrel throughout the study period, and median costs were $5.40 a barrel. At the 95th percentile, the production cost was about $10 per barrel. By contrast, among producers outside the OPEC cartel, median costs were closer to $9.70 a barrel, with the 95th percentile at $28.20 per barrel. Thus, if OPEC withholds production, say by limiting output from its most expensive fields, this will induce production to expand in the more expensive fields in the rest of the world, resulting in misallocated production. If OPEC withholds production from its cheaper fields, such as those in Saudi Arabia, then the resulting cost increase is even higher.
The U.S. oil industry has been shaped, in large part, by the substitution of production away from cheap OPEC reserves toward the rest of the world. In 2005, shale accounted for just 24 million of the 2480 million barrels of oil produced in the U.S., or less than 1 percent. In 2014, 2039 million of the 4173 million barrels of oil produced — nearly half — were from shale. This expansion in higher-cost shale oil production was the primary driver behind an increase in the average cost per barrel of U.S. oil from $7.30 in 2002 to $20 in 2014. The researchers' analysis shows that this expansion in shale oil production would not have occurred if OPEC members had not restricted supply.
To estimate the effect of OPEC's market power, the researchers compare the cost of actual production each year with the cost of producing the same amount of oil using the lowest-cost fields, as would occur in a competitive market. They show that if production were allocated across countries to minimize production costs, then in 2014 the market share of the lower-production-cost Gulf countries would have increased from 25.8 to 74.4 percent. The Saudi Arabian share would increase to 28.1 percent and the Kuwaiti share to 12.5 percent, as opposed to current output shares of 13.3 and 3.0 percent. Production by non-OPEC, higher-cost producers would have fallen, with the U.S. share of the market falling from 13.2 to 1.3 percent and Russia falling from 14.4 to 4.7 percent.
https://jpt.spe.org/production-lifting-costs-shrinking
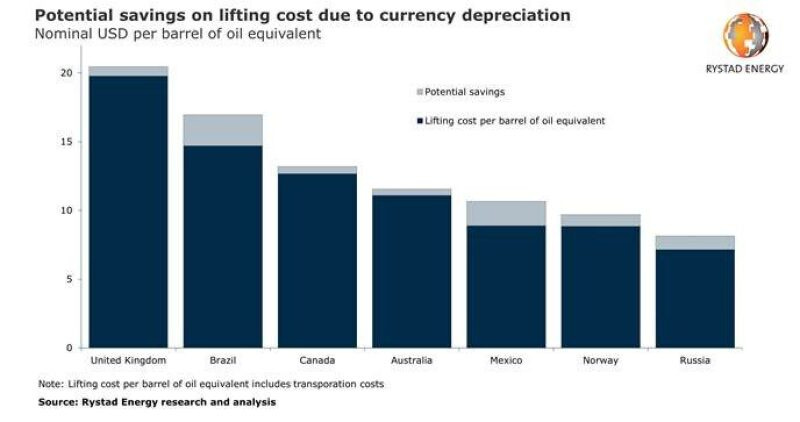
Lifting costs per barrel of oil equivalent (BOE) could drop significantly as a byproduct of the COVID-19 pandemic and price collapse, with Brazil leading the world in savings, according to a recent analysis by Rystad Energy. Rystad calculates Brazil’s savings at $2.30/bbl compared to its pre-downturn estimate. Mexico’s savings rank second, at $1.80/bbl, and Russia’s third, at $1/bbl. The top three savers are followed by Norway, the UK, Canada, and Australia.
The savings result at least in part from the depreciation of global currencies against the US dollar, as most operating expenses (OPEX) in oil and gas production are realized in local currencies. “Currency depreciation could have a mixed effect on oil and gas projects. On the one hand, fields under development may face higher costs, as most of the contracts involved are awarded in US dollars. On the other hand, already-producing fields stand to benefit from depreciating exchange rates, as operating costs are mainly paid in local currencies,” Sara Sottilotta, Rystad Energy’s oilfield services analyst, said.
Lifting costs are calculated as OPEX divided by BOE produced. Adjusting for the share of OPEX purchases made in domestic currencies against the exchange devaluation within the most-impacted countries, Rystad expects potential savings of up to 17% on lifting cost per BOE. Brazil, Mexico, and Russia are poised to benefit most from their local currencies’ depreciation, with OPEX per BOE potentially falling by between 13% and 17%. Lifting cost reductions in the UK, Canada, Australia, and Norway could generate potential savings of between 3% and 9%.
In actual lifting costs, Russia leads savers, at $7.20/bbl. Brazil’s per-barrel lifting cost is now estimated at approximately $14.70. In total, Russia leads in terms of savings for the remainder of 2020. The country’s substantial production will help it realize $8.70 billion in reduced OPEX. Brazil follows with $2.6 billion, Mexico and Canada with $1.6 billion each, Norway with $1.2 billion, and the UK and Australia with $0.5 billion each.
Despite the fact that operators are leaving no stone unturned in their search for further cost savings, Rystad believes that the current downturn is unlikely to generate the same level of efficiency and productivity improvements as in 2014 to 2016; much of the potential has already been exhausted.
“Under these circumstances, currency gains could emerge as a free boost, helping operators to maintain profitable operations at producing fields even amidst the brutal prevailing oil market conditions,” Sottilotta said.
https://surplusenergyeconomics.wordpress.com/2020/01/24/163-tales-from-mount-incomprehension/
Yugo90 on February 6, 2020 at 9:19 pm
Here is an extremely interesting article which goes through the core topics of energetic economics, based on a research project funded by the Finish government, worth reading the summary and the complete report (link inside the article). An utter importance is given the concept of ‘debt exhaustion’, previously discussed here by Dr.Morgan.
Enjoy the read!
https://www.vice.com/en_us/article/8848g5/government-agency-warns-global-oil-industry-is-on-the-brink-of-a-meltdown
drtimmorganon February 7, 2020 at 5:48 am
Good article (with the caveat that renewables aren’t a fix for this problem).
Fundamentally, the ‘real’ economy of energy-determined prosperity, and the ‘financial’ economy of money and credit ‘claims’ on that prosperity, have diverged beyond any sustainable relationship. The financial economy is like a car with no brakes and extremely faulty steering.
rogerglewison February 7, 2020 at 9:36 am
Nafeez Ahmed does not, in my opinion, do the report justice, he does link to the original document though.
Oil from a Critical Raw Material Perspective Simon Michaux
http://tupa.gtk.fi/raportti/arkisto/70_2019.pdf
The report is 500 pages long but not text dense and an easy read and very good reference source, due to fantastic graphics of all of the data sets it analyses. The Report is very strong on the geopolitical and petrodollar aspects of the question and does not major on EROI although it does a good job of introducing the concept.
The report hints at Circular economy but does not go deeply into it, Embodied Energy concepts are absent and the difficulty of applying the Energy insights to an economy historically modelled in Financial metrics is quite apparent, I do not think the report successfully separates the two things out although it does highlight the apples and oranges comparison problem.
https://www.countercurrents.org/wild140910.htm
https://web.archive.org/web/20190306141841/http://theoildrum.com/node/6912
Swedish Enlightenment.February 12, 2013
Austerity, Enlargement and Monetary Union. The End of European Democracy. Not Waving But Drowning.February 24, 2017Liked by 1 person
The Military Industrial Complex and Brexit. A hypothesis. #EUMilitaryUnification #Brexit #Brino #JoCox #AnnaLindh #OlofPalme #TINAMarch 12, 2019Liked by 1 person
Published by rogerglewis
Real Estate Entrepreneur. http://www.realrld.com/View all posts by rogerglewis
Posted in Uncategorized2 CommentsEdit
2 thoughts on “Sweden Switches Sides ( Dagen H (H day) #Swexit #PeakOil, Geo-Politics and False Narratives.”
February 13, 2020 at 5:08 am Edit
A very interesting article. Energy is the real Global Currency and of course, Pipelines are the new Black, as with all ubiquitous supply inputs its the distribution system and Pipelines for Oil and Gas has been the Subtext of Geo Politics the past couple of decades certainly in Syria, Ukraine and Myanmar.
House of Commons 12 02 20 12 09 36 Blackford does the Gloablists EU's Bi… https://t.co/Xw8dkzkLEk via @YouTube
— GrubStreetJournal (@GrubStreetJorno) February 13, 2020
OPEC's Market Power and Cost Misallocation (NBER Paper, 2017):
Production costs vary dramatically by region:
Ghawar field (Saudi Arabia): $7/barrel
Norwegian offshore fields: $21/barrel
Bakken shale (US): $51/barrel
OPEC members have significantly lower production costs:
Saudi Arabia/Kuwait median: $5.40/barrel (95th percentile: $10/barrel)
Non-OPEC median: $9.70/barrel (95th percentile: $28.20/barrel)
Market distortion cost: $163 billion (1970-2014) due to production shifting to higher-cost fields
Shell's Conventional Oil & Gas Operations (2015-2019):
Significant cost reductions achieved:
2015: $14/barrel of oil equivalent
2019: $7/barrel of oil equivalent
Future target: $5-6/barrel of oil equivalent
Operational improvements through:
Portfolio high-grading
Operational excellence
Strategic divestments
Focus on core assets
EIA Data on Finding and Lifting Costs:
Finding costs decreased to $18.31/boe (2007-2009)
Lifting costs fell to $10.04/boe in 2009
Combined costs reduced by over $5/boe to $29.31/boe
Market Structure Impact:
Without OPEC restrictions, market shares would be dramatically different:
Gulf countries would increase from 25.8% to 74.4%
Saudi Arabia: 13.3% to 28.1%
Kuwait: 3.0% to 12.5%
US would decrease: 13.2% to 1.3%
Russia would decrease: 14.4% to 4.7%
This data suggests that while technological improvements and operational efficiencies have reduced production costs across the industry, OPEC's market power forces production to occur in higher-cost regions, creating significant global economic inefficiencies. The actual cost structure of oil production is thus heavily influenced by political and market power considerations rather than purely economic efficiency.
#295: Beans on tech
Posted on December 12, 2024
AT THE END OF TECHNOLOGICAL HUBRIS
There’s a fair chance that this might be the last article published here in 2024.
Peak oil and the EROI scam is basically just that a theory unsupported by Empirical evidence, Lifting costs are decreasing and production increasing . The Narratives are fabricated to support the Price floor scheme that has been in place since the 1930's
Tim Morgans Seeds Falsified? Peak Oil Falsified.
The Peak Oil theory refuses to die, it is contradicted by the evidence.
https://grubstreetinexile.substack.com/p/tim-morgans-seeds-falsified-peak


