


Home@ix Formula for Affordable Housing Provision Part 2
Understanding Affordable Housing

Report
Introduction
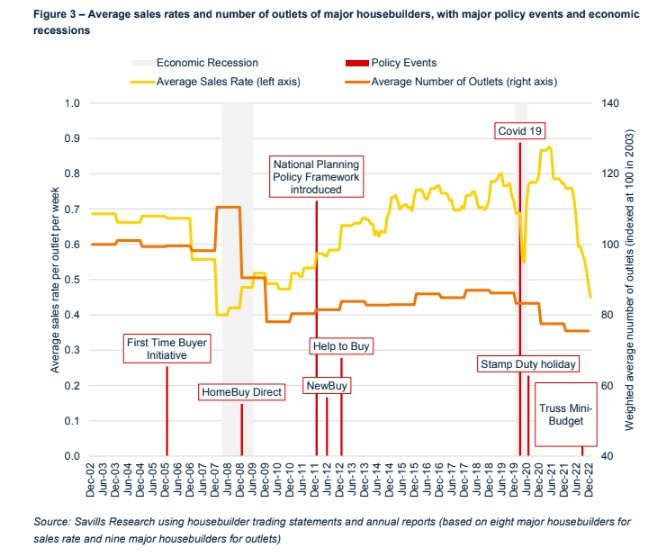
This document analyzes the average sales rates and the number of outlets for major housebuilders, highlighting the impact of significant policy events and economic recessions.
The core findings indicate a fluctuating trend in sales rates and outlet numbers, particularly influenced by policy initiatives and economic conditions.
Section 1: Average Sales Rates
The average sales rate per outlet per week has shown a general decline from 2003 to 2022, with notable fluctuations during economic recessions.
Key events such as the introduction of the National Planning Policy Framework and the Help to Buy scheme had a positive impact on sales rates.
For instance, the sales rate peaked during the Covid-19 pandemic, indicating a temporary surge in market activity.
Section 2: Number of Outlets
The average number of outlets has varied significantly over the years, with a marked increase during specific policy events.
The data indicates that the number of outlets reached its highest point during the Covid-19 period, suggesting an adaptation by housebuilders to changing market conditions.
Events like the Stamp Duty holiday also contributed to short-term increases in the number of operational outlets.
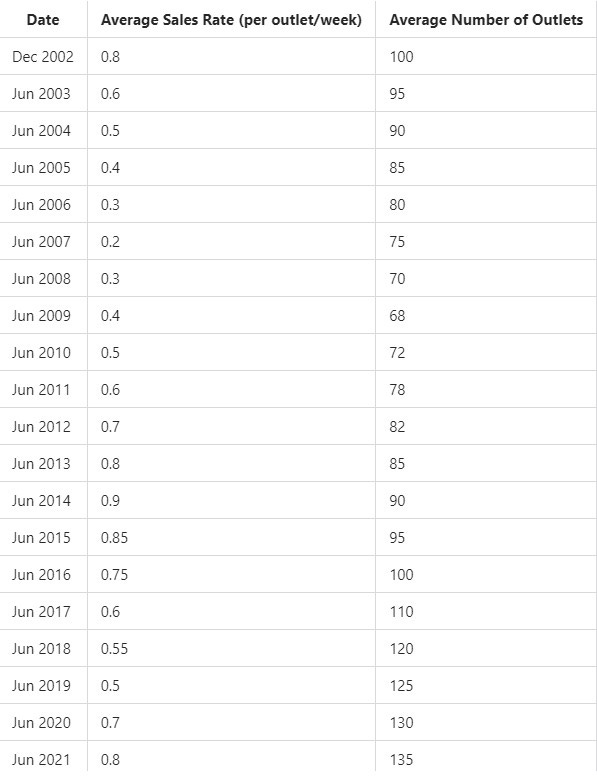
Section 3: Data Table
Conclusion
The analysis reveals a complex relationship between policy events, economic conditions, and the performance of major housebuilders.
The fluctuations in average sales rates and the number of outlets underscore the importance of responsive policy measures in stabilizing the housing market during economic uncertainties.
Following
The standard method shifts to a stock based approach, with housebuilding at the rate of 0.8% to be the new baseline, with an affordability based uplift added for the areas with the highest demand.
In 2022-23, 55% of LPAs had delivery rates of 0.8% of stock or higher. But as the map below shows, many of those falling short of this measure are in London and the wider South East. These are the locations that will see the highest affordability uplift imposed, likely leading to delivery requirements at c.2% of existing stock - a huge step change needed in delivery.
hashtag#planning hashtag#nppf hashtag#housing
Activate to view larger image,

Activate to view larger image

Conclusion
Thus, we have derived the comprehensive accounting identity for Affordable Housing Need (AN) as:
𝐴𝑁=𝐻𝐷+(𝐻𝑀×𝑃×𝐴𝑅×𝐷×𝑇×𝑃𝑉𝐶×(𝐹−1))+𝑁𝐶𝐶
This formula takes into account the HomeMaker Effective Demand (HD), the proportion of the housebuilding market dedicated to affordable housing, the absorption rate, diversity of housing types, effectiveness of the direct-to-consumer model, planning value capture, and the new circuit of credit creation.
My Intention in setting out this proof is to encourage examination of the reasons that the Problem of finding an affordable home has got steadily worse over the Past 40 years.